
Key Takeaways
- Penetration drives growth more than anything else — how many households buy the category matters far more than frequency or basket size.
- Declining categories are losing buyers first — penetration loss is the leading cause of decline, before anything else goes wrong.
- Premiumisation is a legitimate growth lever — price per volume is evidence-backed strategy, not just an inflation side effect.
- There’s no universal formula, but there is a clear hierarchy — category size adjusts the dial, but penetration and price per volume consistently do most of the work.
Table of Contents
- New Research Points to the Real Drivers
- Revenue isn’t one thing, it’s four
- So which lever actually drives most growth?
- Category size measured by penetration changes the playbook
- What this means for category plans
- The bigger picture
- How do you grow category penetration?
New Research Points to the Real Drivers
We’ve all sat in meetings where the agenda is about “how to grow this category”. Probably many times. So, this new piece of academic research is well worth a read!
A team from the Ehrenberg-Bass Institute for Marketing Science the same group behind decades of “How Brands Grow” thinking, promulgating the proven reality that a brand grows most by winning new buyers, has turned its attention to a closely related question: how do categories grow?
Their study, published in the Journal of Business Research, looked at 13 years of US household panel data across 474 CPG categories to figure out exactly which buyer behaviours actually move category revenue, and which ones are mostly noise.
For anyone working in supplier category management, and for any retail buyer, the findings are a useful reality check.
Revenue isn’t one thing, it’s four
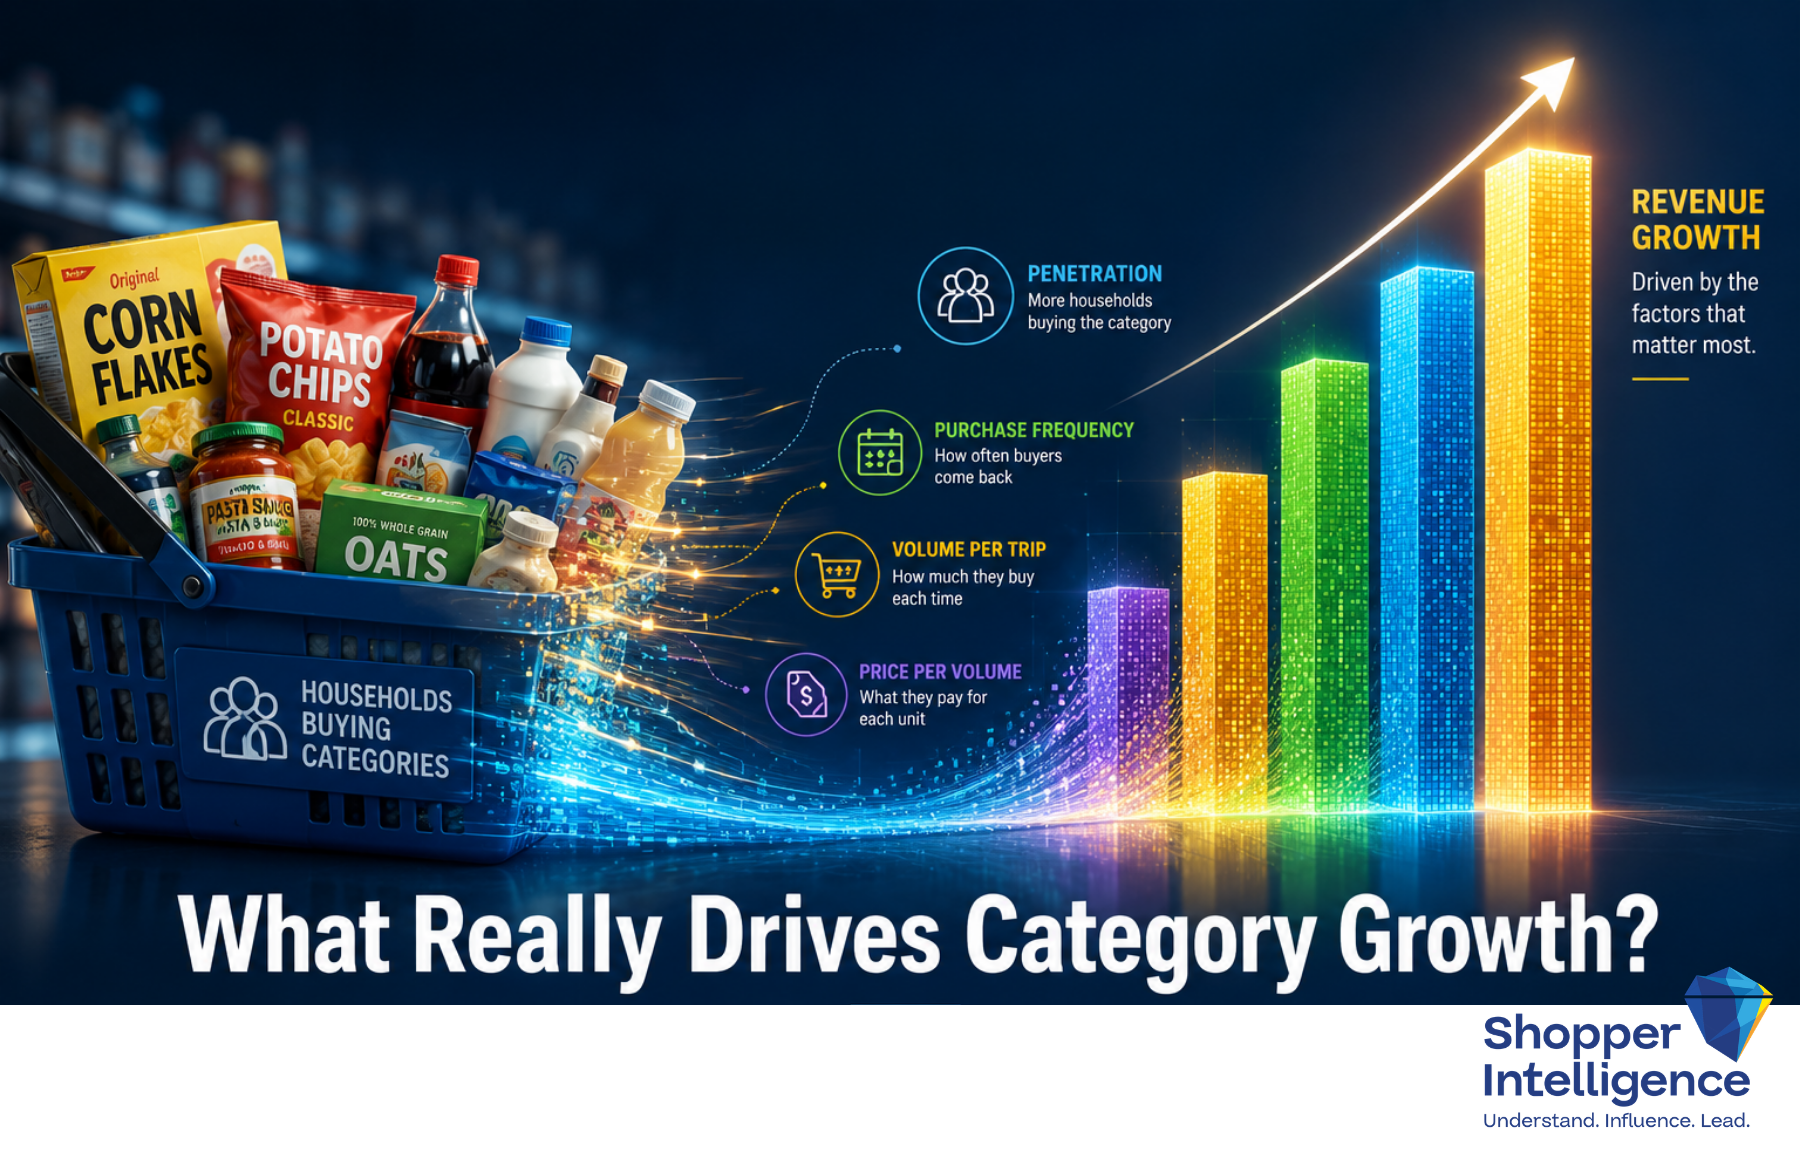
The researchers’ first contribution is a reminder, but it matters a lot in practice. As we all know, growth can come in one of four ways:
- Penetration: how many households buy the category at all
- Purchase frequency: how often buyers come back
- Volume per trip: how much they buy each time on average
- Price per volume: what they pay for each unit
So, any change in category revenue is really just some combination of movement in these four levers.
That sounds obvious once it’s spelled out, but too many commercial conversations still talk about “growth” as if it’s one undifferentiated thing which makes it hard to know how to focus resources and efforts.
So which lever actually drives most growth?
The study at least gives us a firm answer. Penetration increases and price per volume are the primary drivers of category revenue growth. Frequency and volume per trip play a much smaller role, they rarely move the needle on their own.
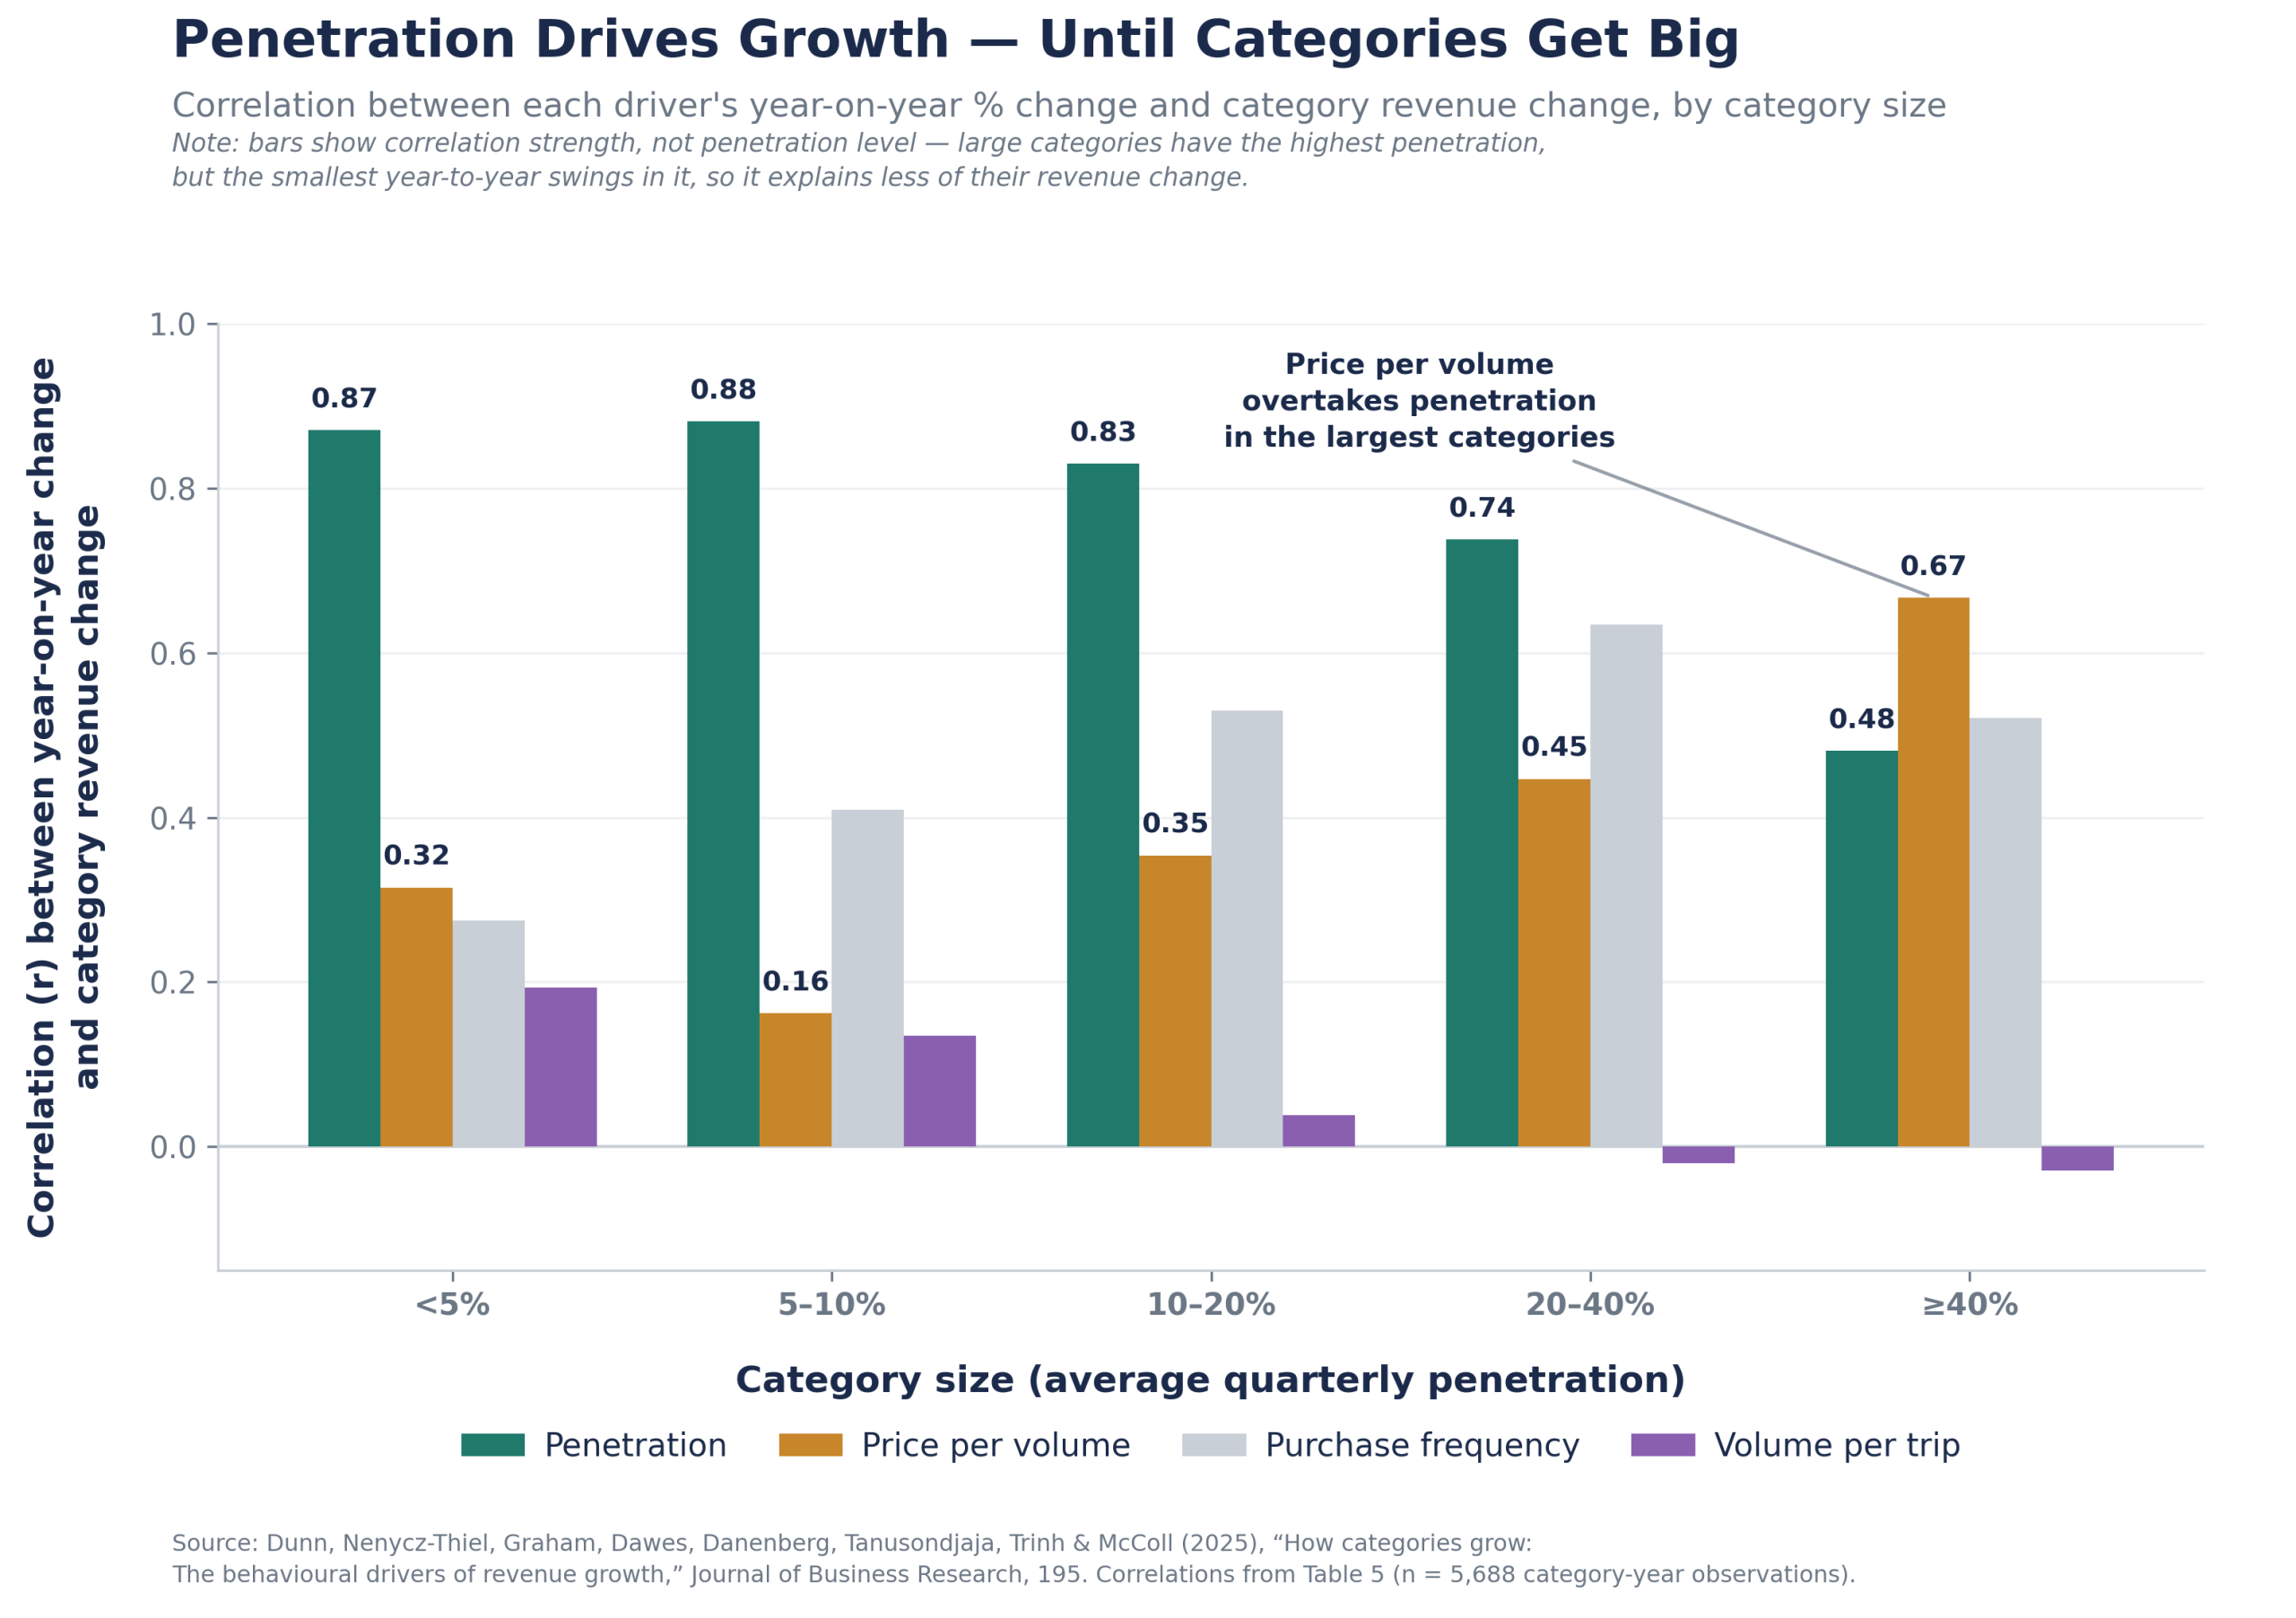
And the flip side inevitably is just as important: penetration loss is consistently the leading cause of category decline, regardless of category size. Categories that shrink are losing buyers, not just losing frequency or basket size.
It makes sense that this is the case. It’s the same story as it is for brands. After all, the underlying drives are the psychology of purchasing and the nature of we humans, whether we are talking category or brand.
Category size measured by penetration changes the playbook
There is one other interesting wrinkle: category size affects how much each lever contributes and how big the resulting growth tends to be. A small, niche category and a large, mainstream one doesn’t grow the same way or to the same degree, even though penetration and price per volume remain the dominant forces in both. In other words, there’s no single universal growth formula but there is a consistent hierarchy of what matters most, with category size adjusting the dial rather than changing the order of priorities.
What this means for category plans
A few practical takeaways for anyone building a category strategy or a retailer pitch:
Protect and grow your buyer base first. If frequency or basket-size promotions are the centerpiece of a category growth plan, this research suggests they’re solving the wrong problem. The bigger prize and the bigger risk are in who’s buying the category at all.
Watch penetration like a smoke alarm. Declining categories are usually leaking buyers before anything else goes wrong.
Price per volume isn’t just about inflation. The study’s other big lever price per volume is a reminder that premiumisation, pack architecture, and mix decisions are legitimate, evidence-backed growth strategies in their own right, not just something that happens to a category because of macro pricing pressure.
Size your ambitions to your category. A growth target that worked for a large, established category may simply not be realistic or may be wildly conservative for a smaller, more niche one. Benchmarking against categories of a similar size and structure will give a far more honest read on what “good” looks like.
The bigger picture
This research adds a layer of empirical rigor to something category managers often sense intuitively: not all growth tactics are created equal, and where you spend your finite time, budget and shelf space matters enormously. Penetration and price per volume aren’t just two of four equal options they’re doing most of the work, in both directions.
It’s a useful piece of science to keep in your back pocket next time a plan leans too heavily on frequency driving tactics. The data says the bigger opportunity and the bigger risk is almost always in who’s buying.
How do you grow category penetration?
Well now we know this is the big question, you will need as much insights about what brings shoppers in, what they want and how you lose them as you can possibly get hold off. And that’s where Shopper Intelligence just might give you a helping hand!
Written by Roger Jackson, Shopper Intelligence CEO
Reference: Dunn, S., Nenycz-Thiel, M., Graham, C., Dawes, J., Danenberg, N., Tanusondjaja, A., Trinh, G., & McColl, B. (2025). How categories grow: The behavioural drivers of revenue growth. Journal of Business Research, 195, 115385.